Presenters use templates to maintain audience engagement in communication. In this regard, infographic templates assist in clarifying information and statistical details. These templates can represent complex data and give insight into a particular topic. Institutions widely use infographic templates to visualize the structure of larger facts.
The pre-designed infographic slide provides consistency and professionalism in presentation. To create versatile presentations, Google Slides and PowerPoint contain built-in templates. Users can find presentation templates online in PowerPoint and Google Slides formats. For this purpose, we have listed down the best 8 infographic presentation templates.
In this article
Part 1. What Are Infographics and Why Use Them?
In the graphics design field, infographic is a 15-year-old term, but for beginners, it might be a new term. Infographics refers to the representation of information in a graphical format. Primarily, infographics aid in simplifying complex data and keeping attention toward presentation. There are various types of infographics PPT that serve different purposes. Let’s explore its few types below:
- Informational Infographics: An infographic that presents factual information concisely is an informational infographic. It describes and emphasizes key points of a specific subject.
- Statistical Infographics: It shows survey results and numerical data in an understandable manner. Users can highlight market trends and make comparisons through various charts and graphs.
- Process Infographics: These templates can explain step-by-step procedures, sequence, and workflow. Flowcharts, arrows, and linear diagrams are mostly used to show process infographics.
- Timeline Infographics: This type highlights milestones or gives an overview of historical events. With icons, labels, and lines, you can get a clear picture of the timeframe.
- Hierarchal Infographics: It presents structured data and shows a sequence of information. In that infographic, data gets arranged in ascending order, showing levels of concepts.
Why Use Infographics?
To communicate through presentation, different types of infographic templates are available. These templates not only reduce manual efforts but also save time and resources. Despite these benefits, given are a few purposes for using infographics in presentations:
- Enhancing Data Comprehension: Infographic provides clarity through colorful figures, charts, and illustrations. Users can emphasize key points and critical financial statistics by using certain infographics.
- Increasing Engagement: By using infographics, details became memorable for viewers of all ages. In infographics, arranged data conveys a narrative that enhances the audience’s attention.
- Simplifying Complex Information: With infographics, larger data sets get converted into appealing formats. You can compare pieces of information and explain lengthy processes like story-telling flow.
- Consistency and Branding: Templates hold color schemes that maintain cohesiveness in the presentation. Infographics allow users to insert company branding elements to boost brand identity.
Part 2. Best 8 Free Infographics PowerPoint Templates
Infographics are available in many types and work for a wide range of purposes. Creating infographics from scratch might lack consistency and professionalism in design. In this regard, templates are available considering user’s diverse needs for infographics. So, let's discover some creative and useful infographic templates in PowerPoint.
1. Business Leadership Academy Infographics
For business students’ presentations, this template provides an array of choices and layouts. This template provides options to design promotional needs, schedule requirements, and plan courses. With 35 different slides, this template is completely editable and easy to customize.
Infographic slides are available in PowerPoint and Google Slides formats in widescreen ratio. There are calendars, maps, and charts to schedule deadlines or display locations. Moreover, circles and tables display progress in statistical data sets.

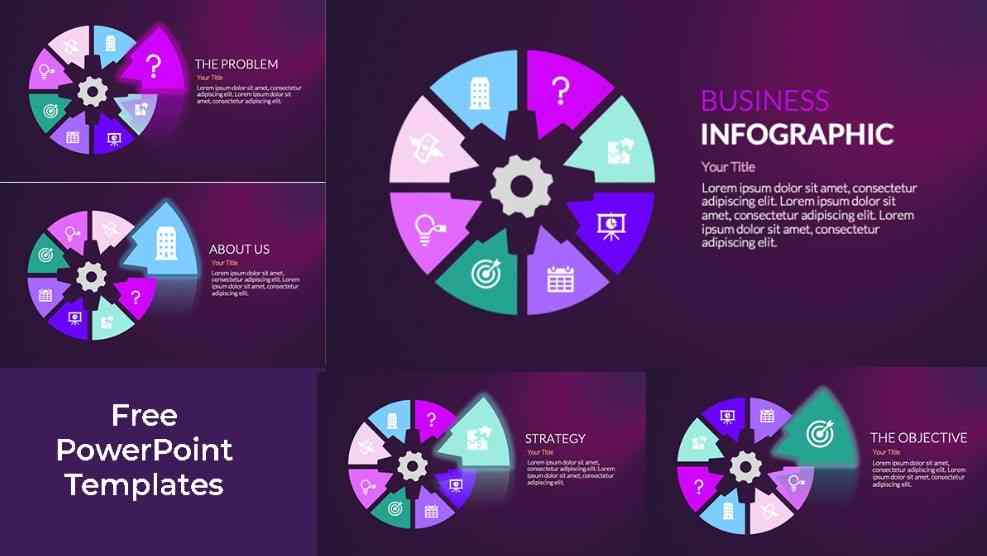
2. Circle Infographic on PowerPoint
To represent an ongoing process in continuity, you can use circle infographic templates. It can display multi-category topics in continuous improvement form. For instance, users can elaborate on their problem or the purpose of the presentation.
Later, they can discuss the budget, solutions, and objectives with strategies. This purple-themed template holds circles with a small part highlighted in slides. It is available to download in PowerPoint format only.
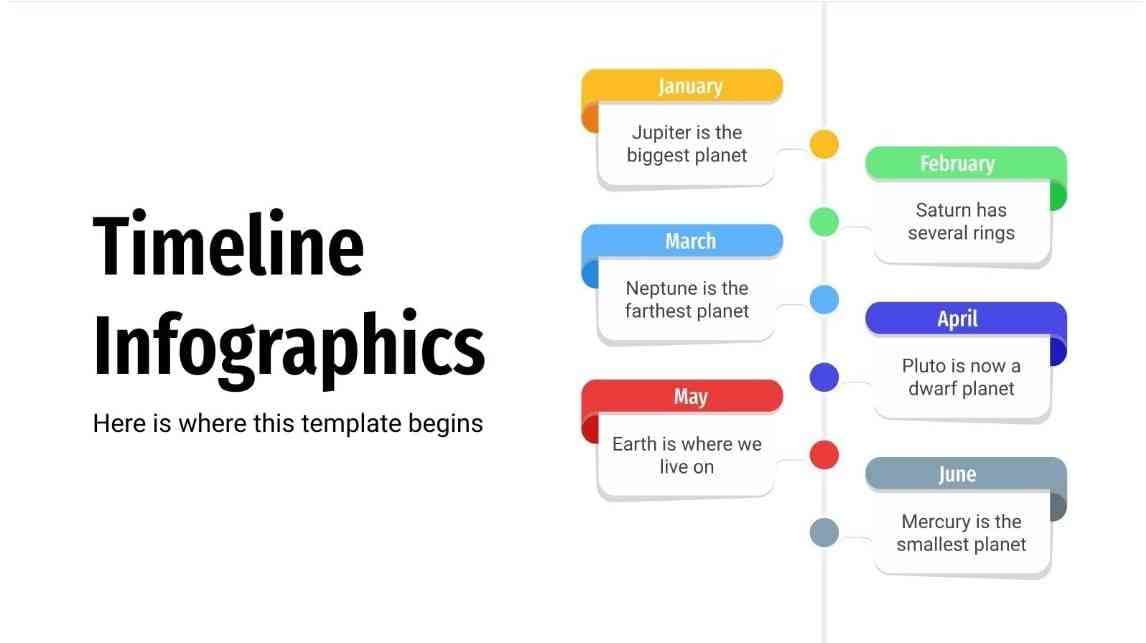
3. Timeline Infographics Template
Timeline templates are great for displaying events and processes in chronological order. So, this template can highlight timelines for school business and marketing purposes. It contains white slides with 33 different editable infographics on them.
Users can visualize hourly, daily, weekly, monthly, or yearly numerical progress with elements. For this purpose, there are colorful circles, boxes, and tables in an organized manner. This infographic template is available in PowerPoint, Google Slide, and Keynote formats.
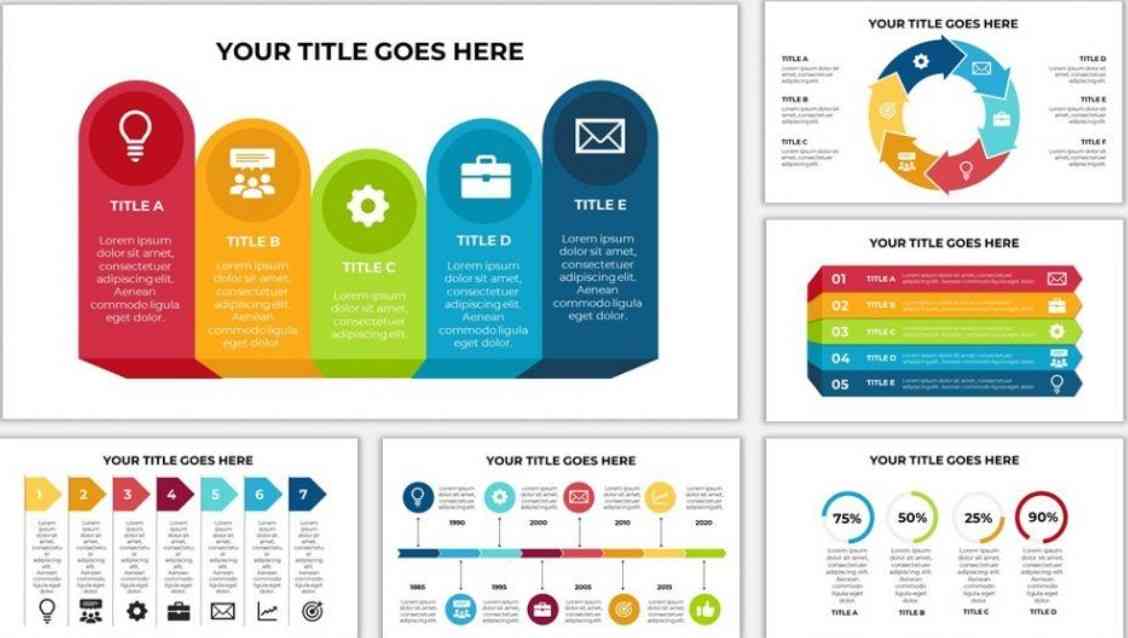
4. Free Infographics for Google Slides or PowerPoint Presentations
This template is available in PowerPoint and Google Slides formats. It holds almost every type of infographic in the slides. Infographic slides are customizable and adaptable for branding needs and colors. It offers a 3-step pyramid and a circled process infographic with pointing arrows.
Moreover, it contains a SWOT analysis, a yearly timeline, and statistical half-circled infographics. Also, it holds almost 2 to 3 slides for informational infographics with 3D tables and arrow icons.
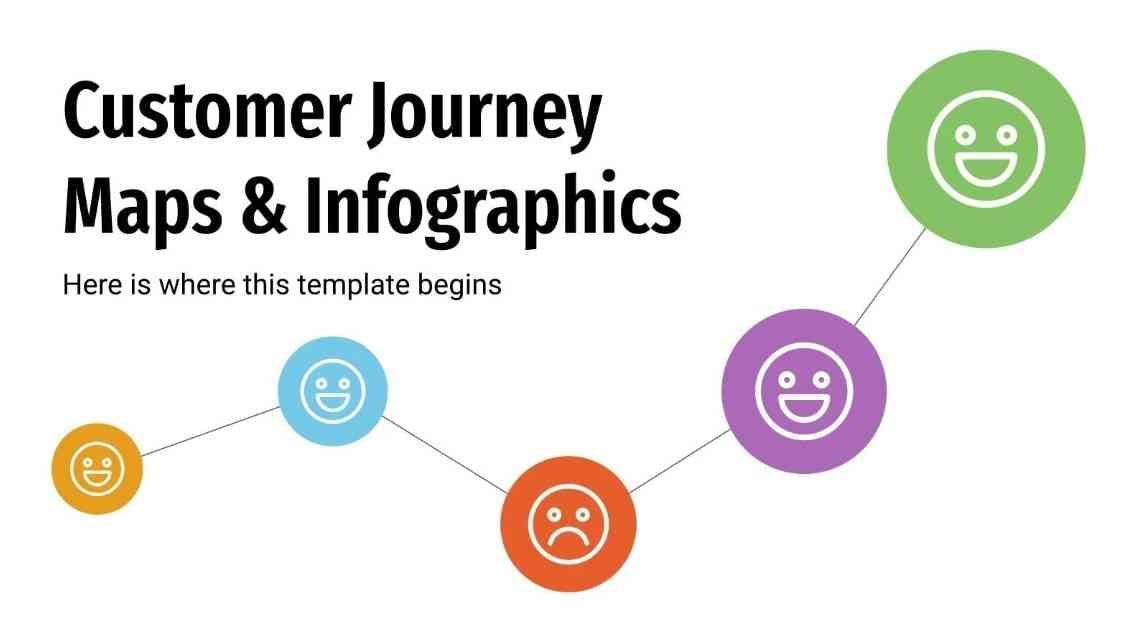
5. Customer Journey Maps & Infographics
Customers have needs, opinions, doubts, and certain motivations behind buying products. Thus, marketing professionals study customer experience and prepare presentations with statistics and facts. This template can display customer journeys with colorful graphics and elements.
It offers 3 extra slides for using instructions and legal rights information. In the template, there are multi-colored graphs, curly-lined processes, and circles as infographics. Some of the infographic slides contain 3D characters that visually support the processes.
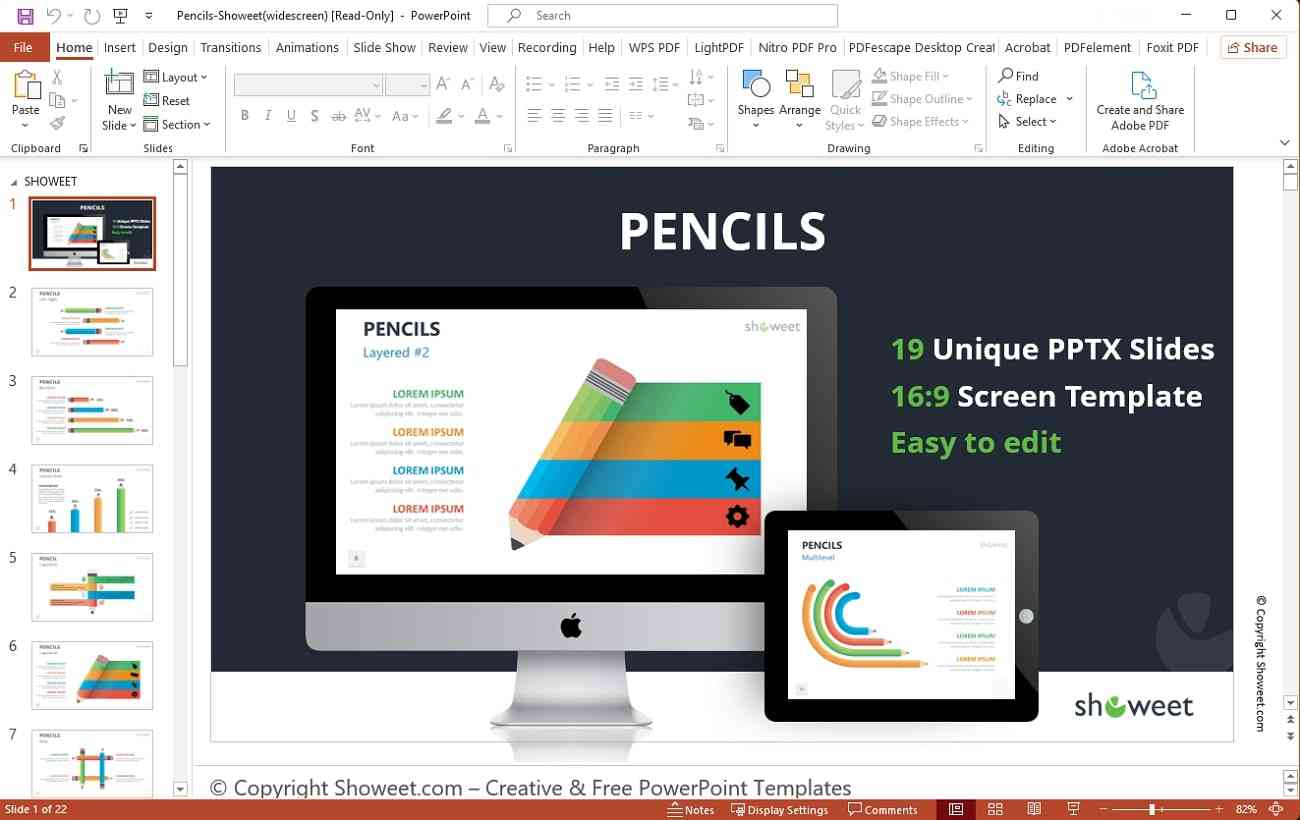
6. Pencils for PowerPoint and Google Slides
Incorporate fun with creativity in your infographics by using this template. For kids' learning and high school presentations, this template offers 19 pencil-shaped infographics. The pencil designs in bar charts, circles, and process diagrams show numerical data.
Moreover, colored pencils can serve as a fountain, snakes, and a squid design. This template offers PowerPoint format within the ratio of standard 4:3 and widescreen 16:9 size.
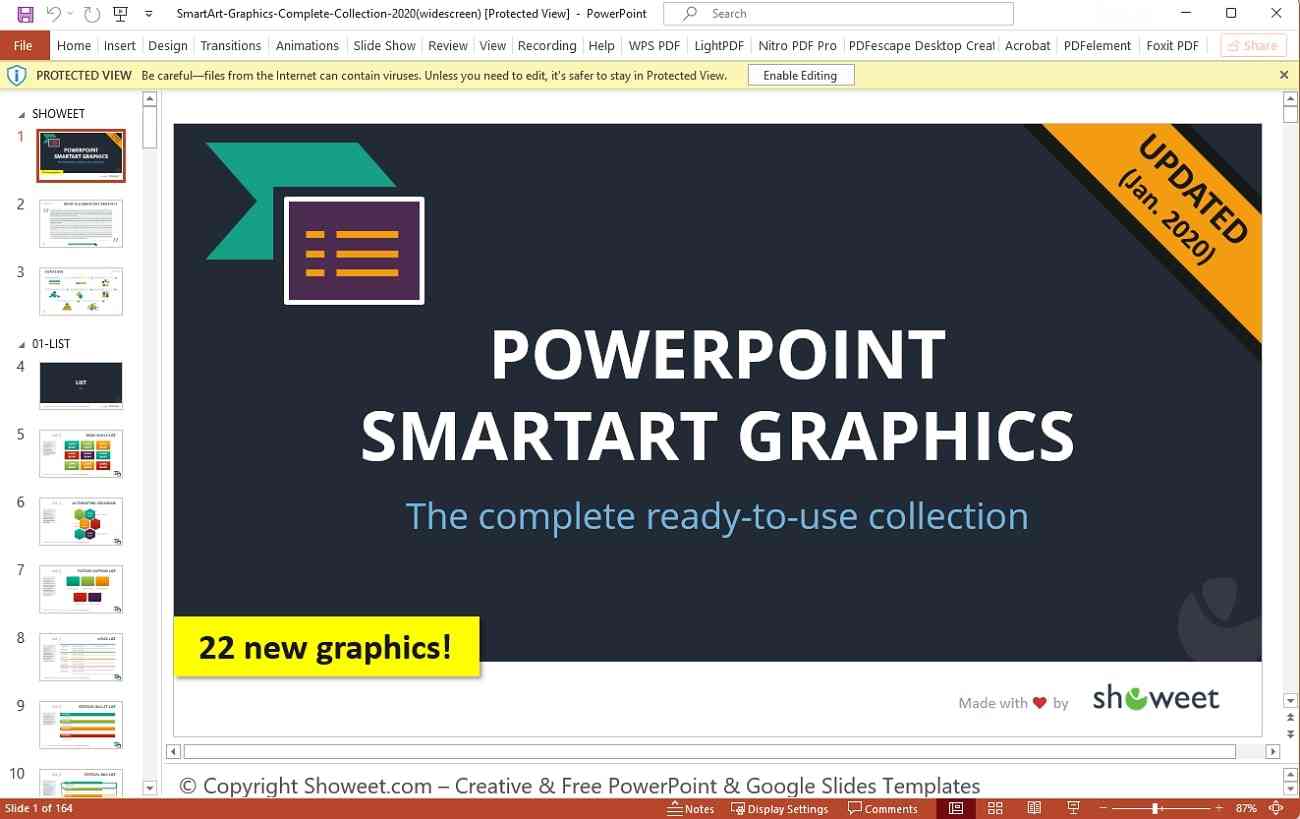
7. PowerPoint SmartArt Graphics Templates
Microsoft PowerPoint contains built-in SmartArt graphics that aid in crafting infographics. There are over 150 SmartArt graphics used in different designs of this template. With a variety of illustrations, it enables customization and downloading in PowerPoint format. Users can even change the shapes and colors of the SmartArt graphics.
There are 8 sections of the cycle, picture, pyramid, relationship, and hierarchy infographic. Many shapes lie within those sections, like the basic, step-down, and accent processes.
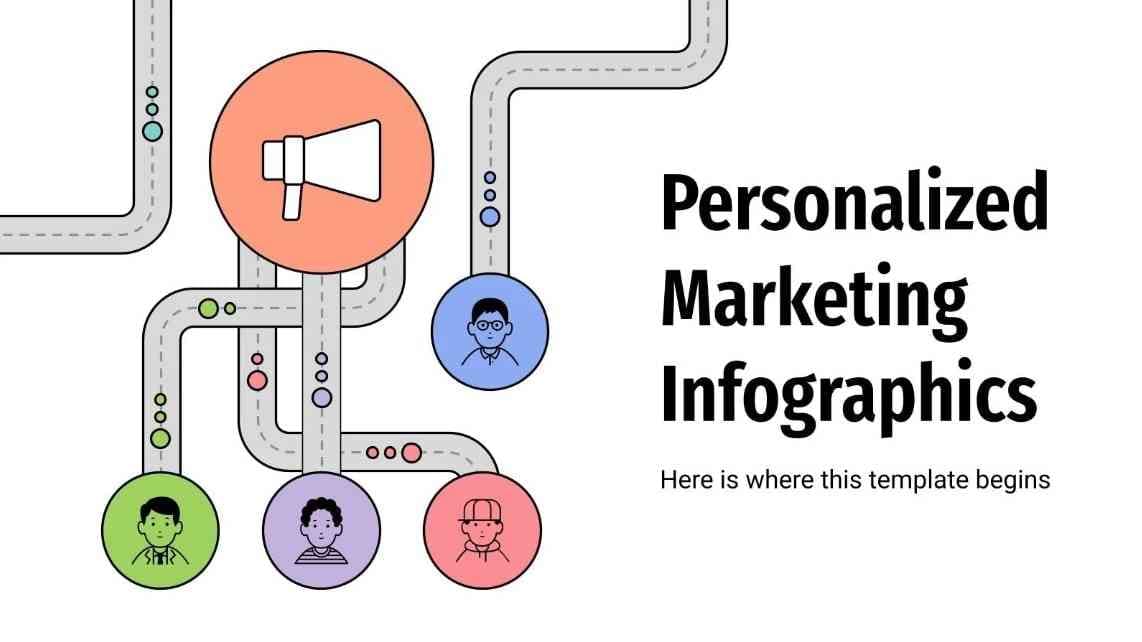
8. Personalized Marketing Infographics Template
Inspire your clients with this specially planned template for marketing business professionals. These infographic slides are roadmap-themed, where different icons connect with customer profiles. For example, announcements, ideas, and shopping bag symbols hint toward customer icons.
Afterward, you can plan marketing strategies through diagrams and tell marketing channels. With this template, users can plan advertisements using infographics with relevant icons. There are 34 slides that are available in Google Slides, Keynote, and PowerPoint.
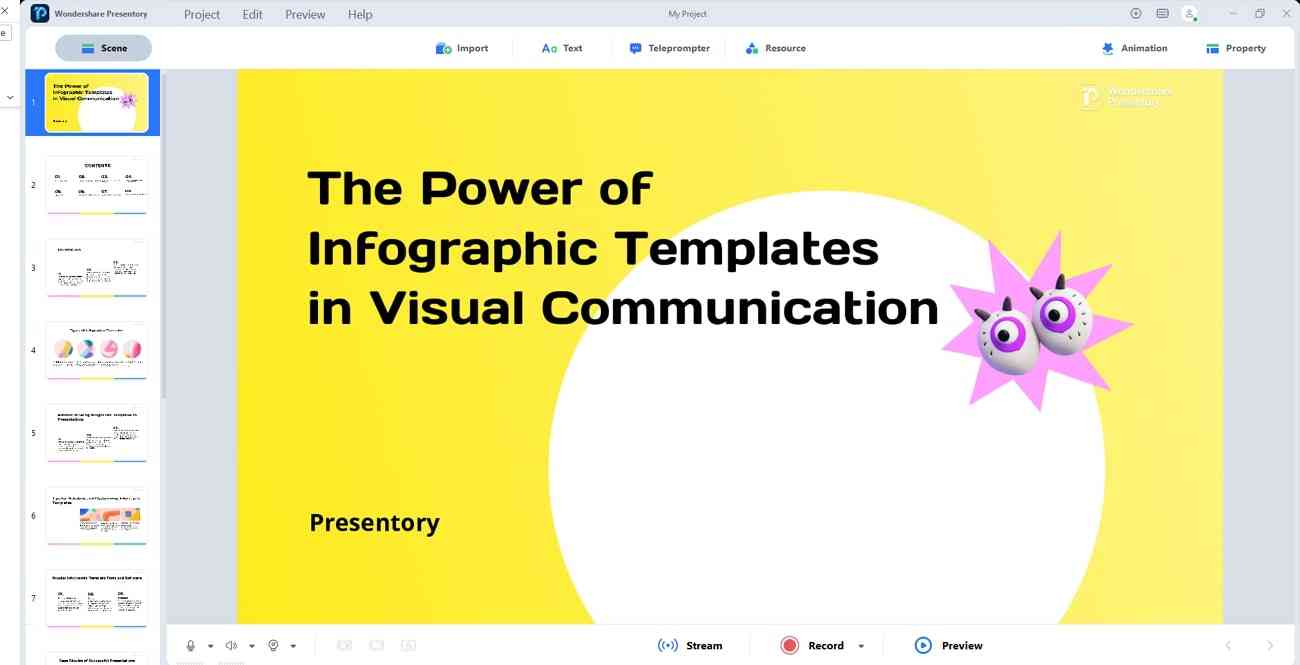
Bonus Tips: Designing Effective Infographics with Presentory
Infographics can make content understandable, but what about the appearance of the presentation? Consider using Wondershare Presentory, which can make your presentations eye-catching. Import infographic slides in this tool and add effects to make them appealing. This AI tool can meet the diverse needs of users in enhancing presentations.
This innovative tool serves business education and other knowledge-sharing purposes. Apart from typical presentations, stream online in meetings and conferences at popular platforms. It provides polished and stunning templates with 3D elements from the resource library. This AI software is available online, or you can download it to your system.
Key Features In Spotlight
Create presentations and enhance infographic templates with AI-powered solutions. This AI tool holds many features to add a finishing touch to your projects. Let’s discuss them in detail to better understand the function of this AI software.
1. AI-generated Content for Presentation
Instead of planning and researching presentations for hours, use Presentory. With built-in AI, this tool can generate detailed presentation outlines of any niche. If you are creating courseware, it generates learning objectives, instructions, and assignments. After getting the content, users can skip or insert details before finalizing it.
2. Attractive Templates and Designs
After outline finalization, this AI software displays the relevant slide templates. Some of the template designs include modern-profession, cartoon-toddler, and lines-corporate training. Instead of pasting content into the presentation, this tool can do this task for you with one click. Also, slides contain high-quality graphics with different layouts and elements.
3. Animations and Transition Effects
Import your infographics template and make them moveable with this AI platform. In your slides, add transitions that give a tech-savvy look to the presentation. Furthermore, inserting animation can emphasize important points in your process infographics. Users can set the order of the applied animations to maintain the flow of the presentation.
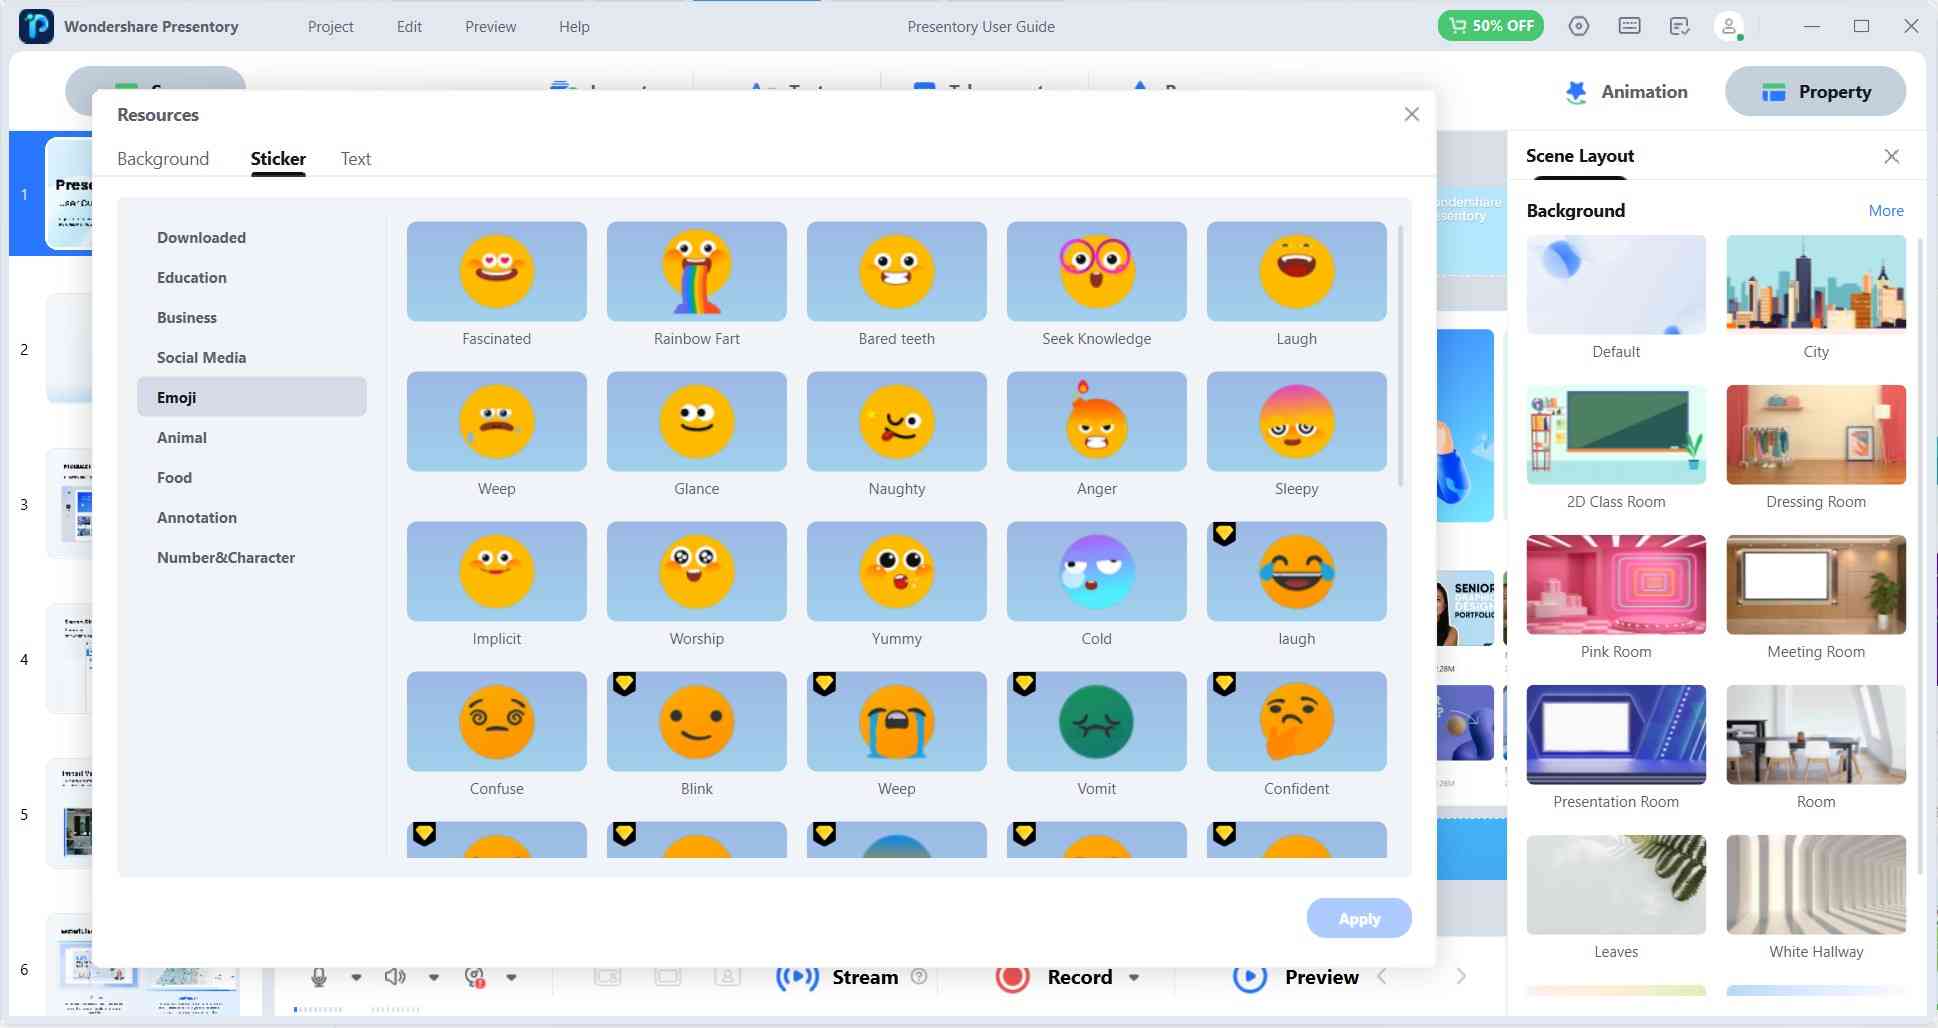
4. Rich Library Resources
From Presentory resources, users can insert backgrounds ranging from bookshelves to meeting rooms. Plus, there are many 3D stickers from education, social media, and many other niches. Moreover, you can add trending text templates and make your brand identity. Apart from rich resources, it also allows you to import elements and objects of your choice.
5. Record or Live Stream at Popular Platforms
In this digital era, people are virtually connected worldwide. This tool offers live streaming on Google Meet, Microsoft Teams, and Zoom. While recording video, enhance facial features and remove blemishes from your face. Users can apply makeup and adjust the brightness of their video presentation.