A world map is a category of an infographic that is used to communicate data visually. They help students understand an event's location or data points in a geographical context. Maps assist decision-makers in picturing the market distribution of products and competitors. While discussing climate change issues, maps can help imagine regional vulnerabilities better.
World map PowerPoint is essential for international relations and geopolitics presentations. They allow comparison within regions and narratively convey your data. This way, you can grasp the audience's attention and make the presentation memorable. This article will show the ways to insert PowerPoint maps. Also, we will showcase 5
In this article
Part 1. Why Is Included in World Maps in PowerPoint Presentations?
Maps are graphical representations of continents and countries across the globe. They add significant value to your data and keep the diverse audience engaged towards the topic. By using world maps, you can con vey geographical data, global topics, and much more. To learn more about why include world map PowerPoint in presentations, read the reasons below:
- Visualize Complex Data: By using colors and annotations in maps, you can convey complex data. Following this, users can also compare population statistics and environmental factors with maps. Animated maps can show events in progression that aid in a storytelling way of teaching. In this way, students tend to remember the facts in a fun and attractive way.
- Decision Making: Maps aid in planning business strategies and resource allocation in regions. They highlight cities and locations for potential projects and expansion plantings. This helps authorities to study areas' demographics thoroughly and make required decisions accordingly.
- Educational Tool: Global maps can elaborate on cultural diversity, global perspectives, and traditions. Also, they help educationists to deliver history or geography-related concepts easily. By visually displaying countries and their attributes, students memorize data for longer.
- Effective Management: For crisis management presentations, maps assist in identifying affected areas. They assist in the speedy recovery process of the most affected areas on the map. In a tourism presentation, a world map provides a clear picture of the destination. It helps both investors and clients understand routes and potential budgets.
Part 2. Guide To Insert a World Map in PowerPoint
Incorporating editable world maps PowerPoint serves many purposes and benefits in various presentations. Due to this, PowerPoint offers a built-in option to insert and customize maps according to the needs. So, let us guide you to insert maps in PowerPoint by following the detailed steps below:
Step 1: First, open the PowerPoint on your system and explore it. Select the “Blank Presentation” option to lead to a new blank slide. Now, head to the top toolbar and click the "Insert" tab. From the "Illustration" section, press on "Chart" to access it.

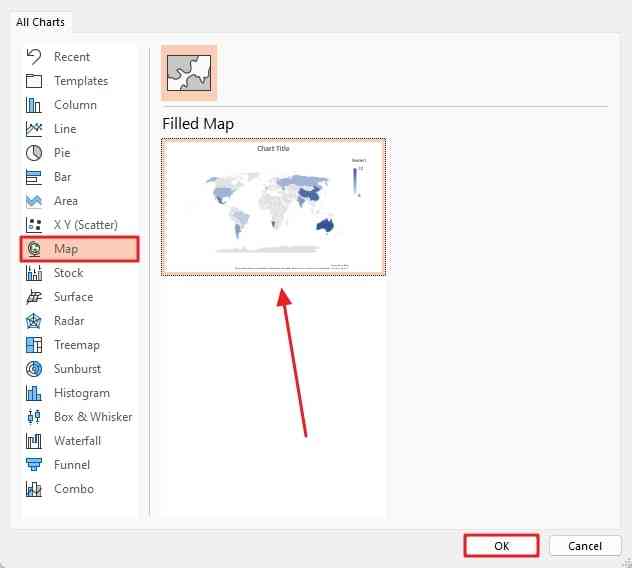
Step 2: After tapping on "Charts," a new "Insert Chart" window will open. There, choose "Map" from the left-side toolbar, and "Filled Map" will appear on the right side. Click the "OK" button there, and the map will be added to the slides.
Step 3: PowerPoint will display a default table in Excel format. It will be named as "Chart in Microsoft PowerPoint." There, you can write country names and values according to your data sets. Thus, the map will change automatically as you change those values on the table.

Part 3. Best 5 Editable World Map Templates
Editable world map PowerPoint saves time and effort of manual customization. The predesigned templates provide a consistent world map with a cohesive visual identity. This way, you have to insert data into predefined fields and shapes to make your presentation unique. We have searched out and mentioned some of the world map templates below to help you make professional presentations.
1. Editable World Map Template
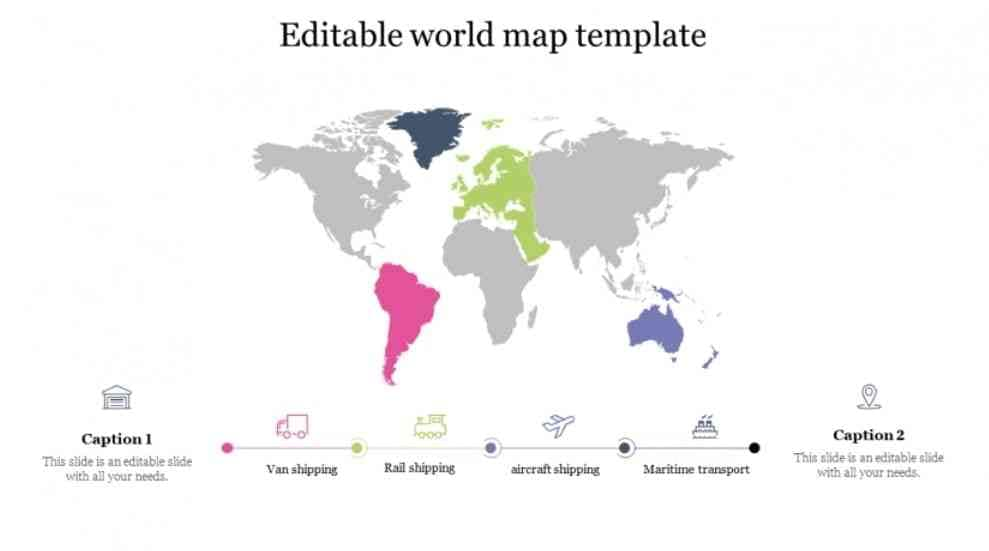
This template is specially designed for international businesses, marketing, and traveling. It provides unique color-coding options to label regions and locations on the map. For instance, the purple areas represent van shipping, and the green areas show rail shipping. 4 outlined symbols include icons of a van, train, ship, and airplane.
The home icon on the map shows the homeland, and the location icon shows the destination. Before downloading in PowerPoint format, you can adjust slides in 16:9 or 4:3 formats. It allows users to change the color and text to customize the template.
2. World Maps Template
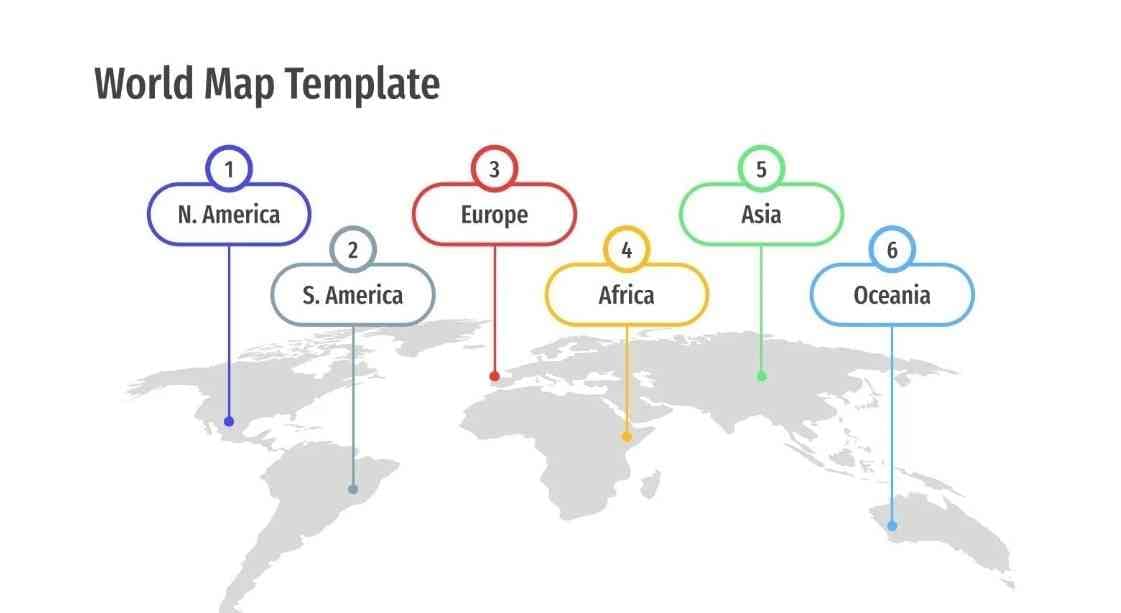
If you want to teach global incidence or diseases through maps, this template can assist you a lot in this. It offers 61 slides that are available in Google Slides and PPT formats. Moreover, it’s a white-themed template that holds red, yellow, blue, and green colors in maps. To illustrate disease, a global map contains heart, brain, and lung icons in a circle.
Furthermore, another slide of this template offers a world map holding achievement icons in rotated squares. This helps users to display their statistical data on separate regions showing specific social media platform usage across countries.
3. Minimalist World Map Pin Timeline
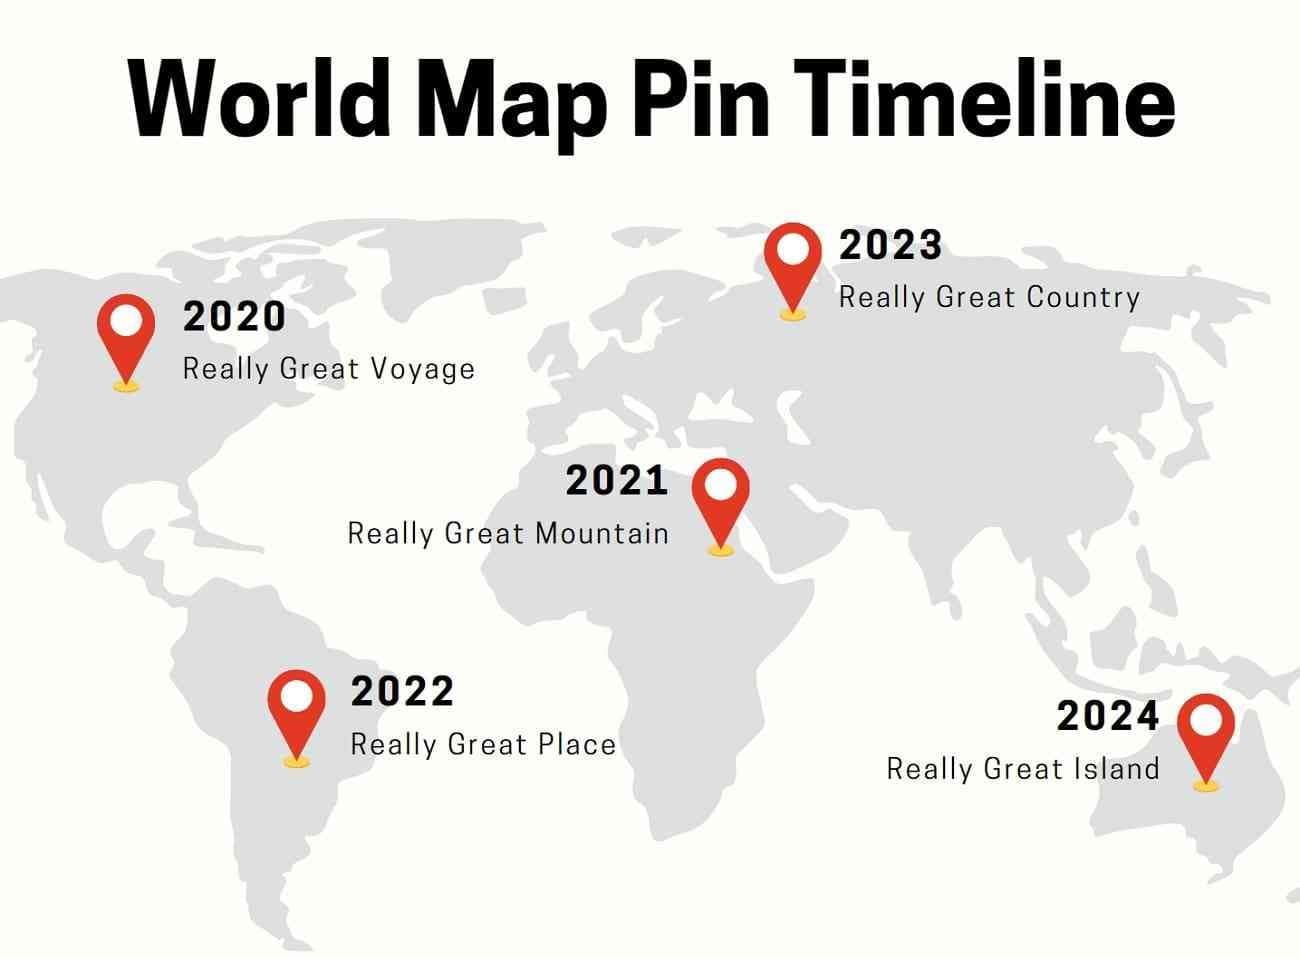
To show progression in regions with the passage of time, use this minimalist world map template. It is because this template offers a white background with grey colored global map on it. There are red-colored location icons on regions that can be changed and modified. Users can even adjust the complete earth map color on the slide.
Furthermore, location names and years are also mentioned in it to show progress in different areas. Users can also animate the map or adjust its transparency on the slide. After editing, they can save the map in PowerPoint and download it in PNG, PDF, and JPG formats.
4. Flat Style World Maps Infographics
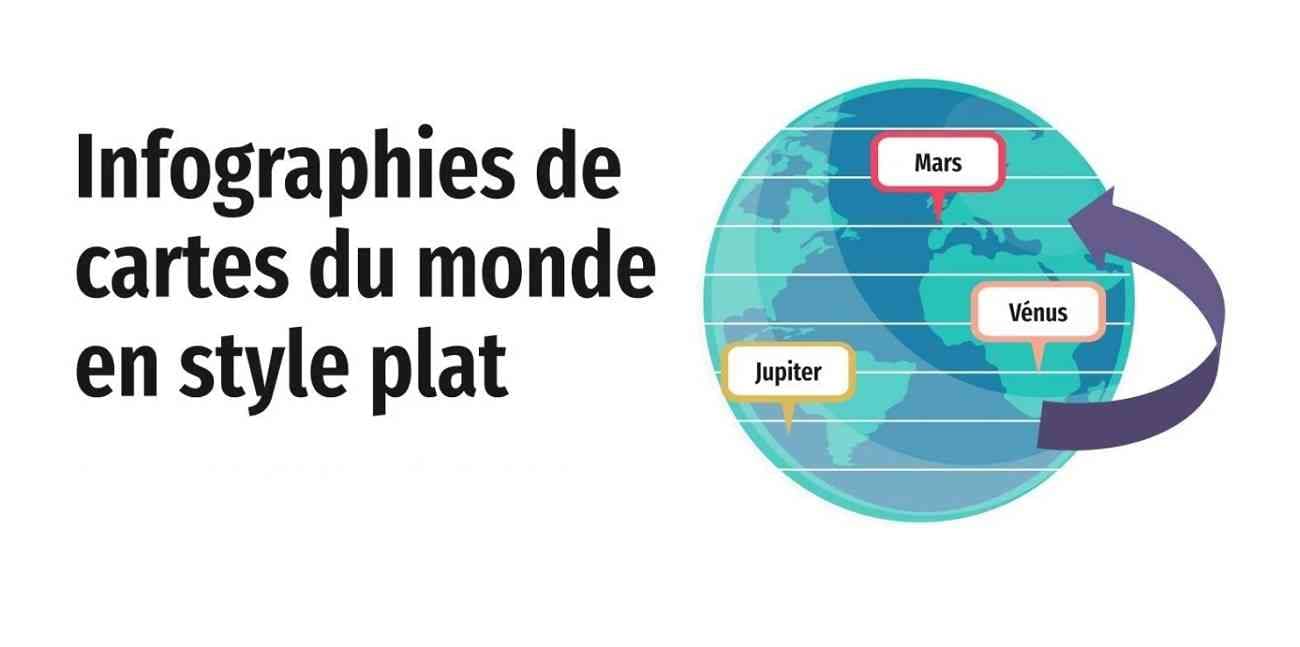
From Moscow to Berlin and Tokyo to France, this template gives a complete world tour. In the first slide, it introduces your topic along with a 3D-looking globe shape. Afterward, represent your numerical data with different colors, charts, and percentage icons. There are animated gender icons that are communicating across countries.
Different colors on maps are used to label detailed messages written outside of it. Also, there are a few round-shaped globes with straight colors and icons coming out of them. These 34 slides offer compatibility in PowerPoint and Google Slides format.
5. Global Technology PPT Template
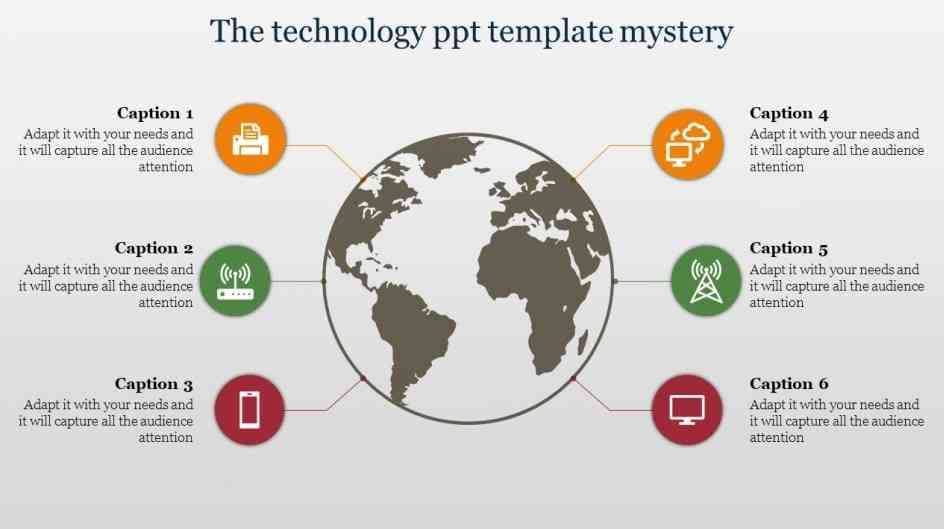
Although it’s a GPS era to get the exact location, presentations will always need a map. This template is designed to check global technology trends, allocation, and services. This one-pager slide template contains a circle-shaped globe of brown color. It is a filled globe icon that contains 6 differently colored nodes around it.
These straight nodes are linked with circled shapes containing various technology icons. Users can write detailed descriptions aside from those technology icons. Besides this, it is an editable world map PowerPoint that is available in 16:9 or 4:3 formats.
Bonus Tip: Convey Complex Information in a Clear and Engaging Way With Presentory
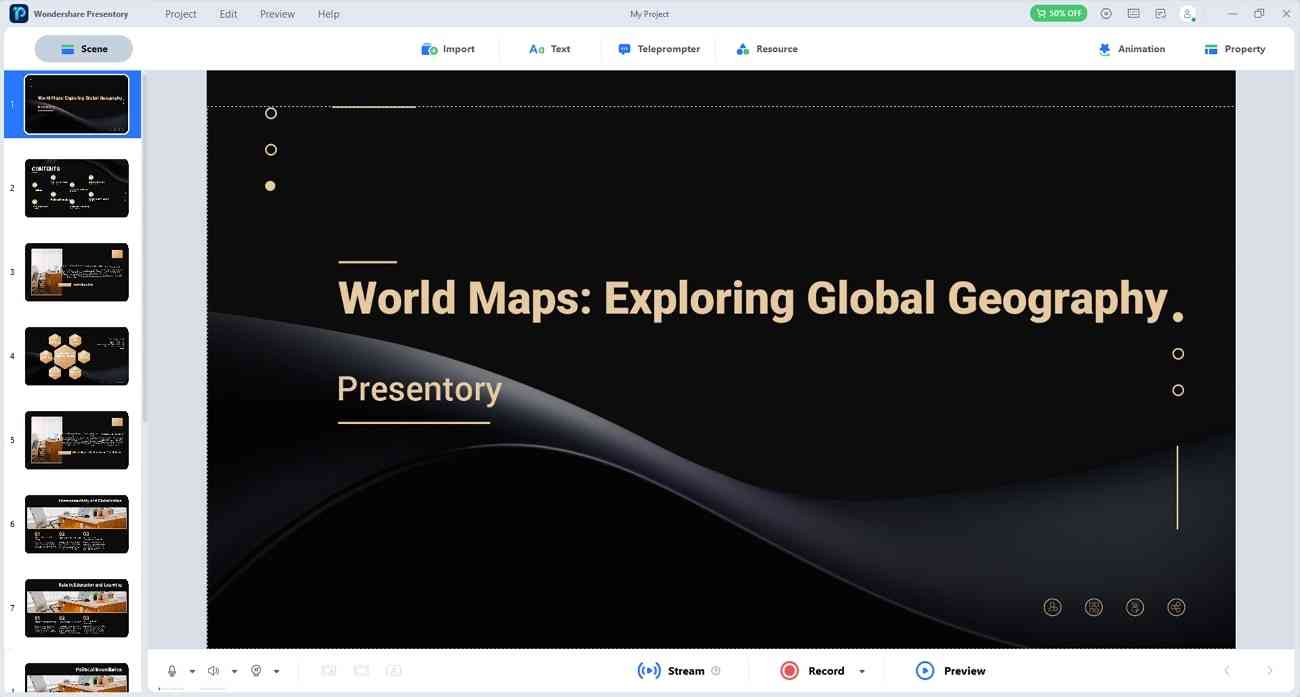
World map templates provide a predefined structure and present an appealing presentation. By adding visual aids to global maps, your content becomes crystal clear to the audience. In this regard, try using innovative AI software named Wondershare Presentory. It can elevate your world map PowerPoint by applying resources, effects, and much more.
With this AI presentation maker, live stream your project in different regions. In addition, users can also insert stickers, popular text, and virtual backgrounds from its resources to enhance their projects. Apart from that, you can read the presentation script from its teleprompter feature. So, it's a platform that can help you create or edit presentations to increase audience attention.
Features Highlighted in Presentory
- Attractive Template: For education, business, or other purposes, it offers stunning templates. Presentory contains built-in editable template designs for diverse users. It provides placeholders for all essential multimedia, like pictures and videos. By using its resources, users can even insert a virtual background of their choice.
- AI-Generated Content: There is no need to spend hours researching presentation outlines. With the AIGC option, add a topic and some details to get detailed presentation content. For instance, select the corporate training section for content and insert a topic. Add the targeted audience and other extra information for accurate results.
- Unique Resources: Visual aids in this AI tool can even enhance boring presentations. It offers a rich resource library for stickers, text, animations, and transitions. To make a breathable presentation, add animations to objects, text, or other elements. You can set order after adding emphasize, appear, and disappear animation to objects.
- Teleprompter: Presenting on an international level might result in forgetting some points. This AI tool provides a solution and allows users to read their script while presenting. You just have to write important points in that section and play it during the presentation. Moreover, you can also change the font size and color as per readability in the delivery process.
- Streaming Across Regions: Live stream your world map PowerPoint on popular platforms. By using this AI software, users can record their presentations to share later. It allows you to record or live stream with beautification effects to enhance the videos. Presenters can live stream their videos on slides and then change the layout of videos as well.
Conclusion
In short, editable world map PowerPoint can visualize boring data in a clear picture. For marketing, crisis management, or educational purposes, world maps play a vital role. Considering its benefits, we have guided you on how to insert a world map in PowerPoint with detail. Plus, we have outlined 5 best templates above to help you customize them on the go.
To create a breathable and exciting world map presentation, use Wondershare Presentory. This AI presentation maker lets you import a PowerPoint and edit it using resources. For engaging content, use AI-generated content features for presentation outlines. Further, users can apply makeup and remove blemishes from their faces while streaming.