Venn diagrams have the ability to clarify complex information. It offers a visual representation of your demonstration to the audience. Moreover, it can make your document or presentation concise. You can also organize and sort out multiple concepts using the Venn diagrams. Hence, these PowerPoint, Docs, and Google Slides diagrams can make your content engaging.
This guide will provide different ways to create PowerPoint Venn diagrams. Moreover, you can also discover how to create Venn diagrams in Google Docs and Google Slides. Thus, keep reading this article to learn more about the Venn diagrams.
In this article
- What is a Venn Diagram and the Purpose of Using It?
- Creating Venn Diagram Using Google Docs
- How to Generate Perfect Venn Diagram in Google Slides?
- Venn Diagram Creation Using PowerPoint
- Top 3 Templates Of Venn Diagram for Google Docs, Google Slides, and PowerPoint
- Bonus Tip. Create AI-Powered Presentations or Modify Old Presentations with Presentory
Part 1. What is a Venn Diagram and the Purpose of Using It?
A Venn diagram is a visual representation of overlapping circles. Each circle represents a set, object, or element. The overlapping area of the circles shows a relationship between the sets. Venn diagrams are commonly used in data analysis and comparisons. They can also be used for educational and business purposes. Here are the major uses of the Venn diagrams explained below:
1. Analyzing a Relationship
Researchers use the Venn diagrams to research the relationships between variables. By visually displaying the relationship between variables, you can simplify the information. Moreover, highlight the role of external factors in influencing your subject through Venn diagrams.
2. Solving Problems
Each problem can be solved with multiple methods. Organize the techniques and methods to solve a particular problem with the Venn diagrams. Moreover, it can help the audience to recognize the effective solutions. Thus, you can use the Venn diagrams for brainstorming while solving multiple problems.
3. Classifying Data
The biggest benefit of the Venn diagram is that it can classify data, items, or elements proficiently. You can use it to create a comparative analysis. It can be used to highlight the major differences between the discussed items through the Venn diagrams. Moreover, it can also shed light on the common factors of the items.
4. Survey Analysis
If you want to understand the behavior patterns of respondents in a survey, Venn diagrams can help. With the overlapping circles, you can discuss the common responses of the audience. Thus, Venn diagrams can greatly help recognize the correlations and patterns in a survey analysis.
Part 2. Creating Venn Diagram Using Google Docs
Google Docs are widely used to explain content in a textual manner. You can also use the Venn diagrams for a simple representation of the data. In Google Docs, you can easily create Venn diagrams using a drawing tool. Here are the steps you can use for creating Venn diagram Google Docs:
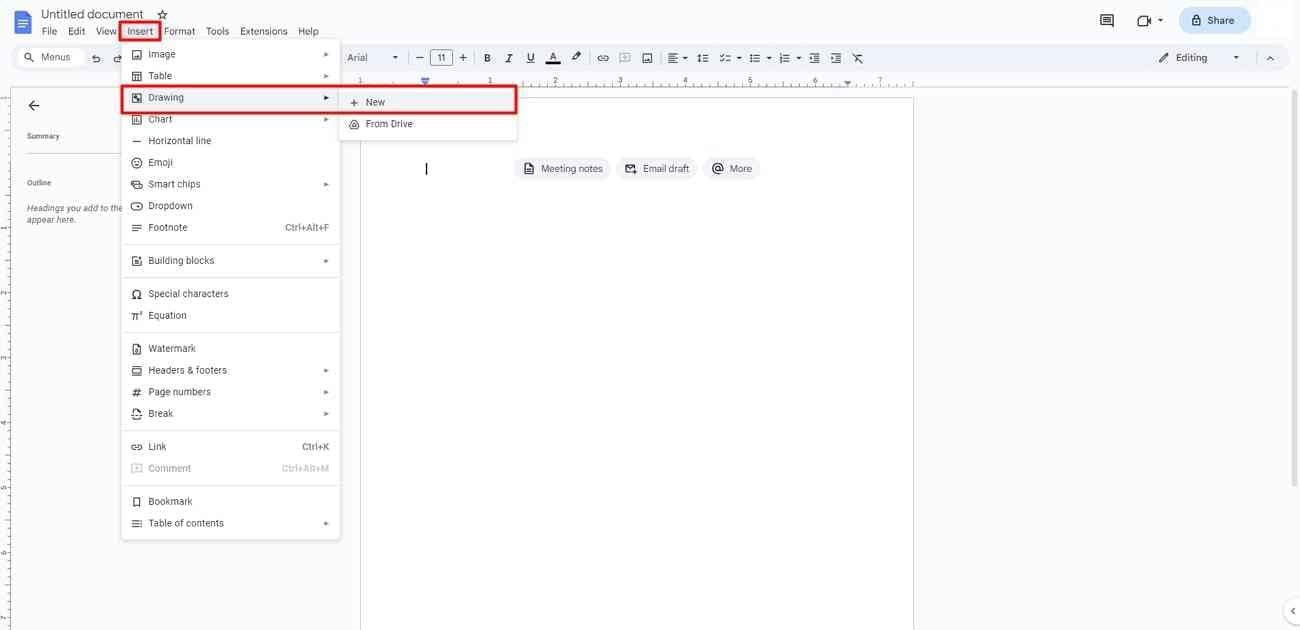
Step 1. Open a blank document on Google Docs and go to the "Insert" option. From there, click “Drawing” and select the "New” option.
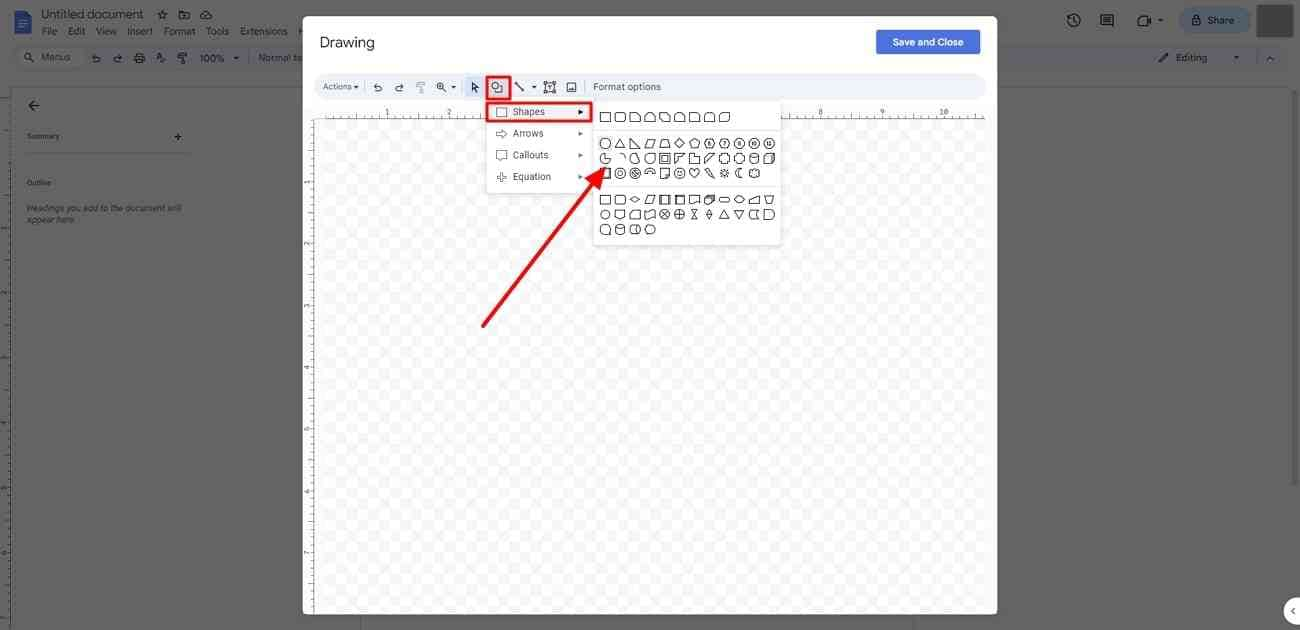
Step 2. You can see a drawing panel on your screen. From the given options, click on the icon of shapes. Afterward, select “Shapes” and choose the “Oval” shape.
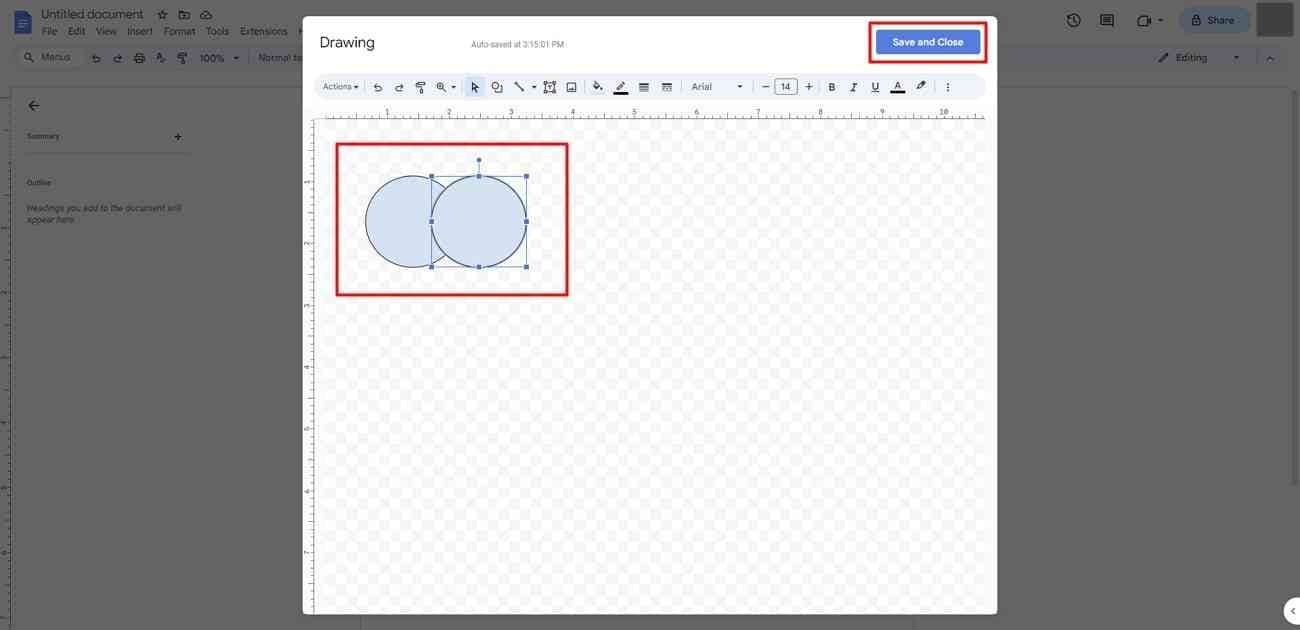
Step 3. Click and drag the oval shape according to your desired size. Now, using your keyboard, copy and paste the created circle. Adjust the position to overlap it with the first created circle. Click on the “Save” button to save the Venn diagram.
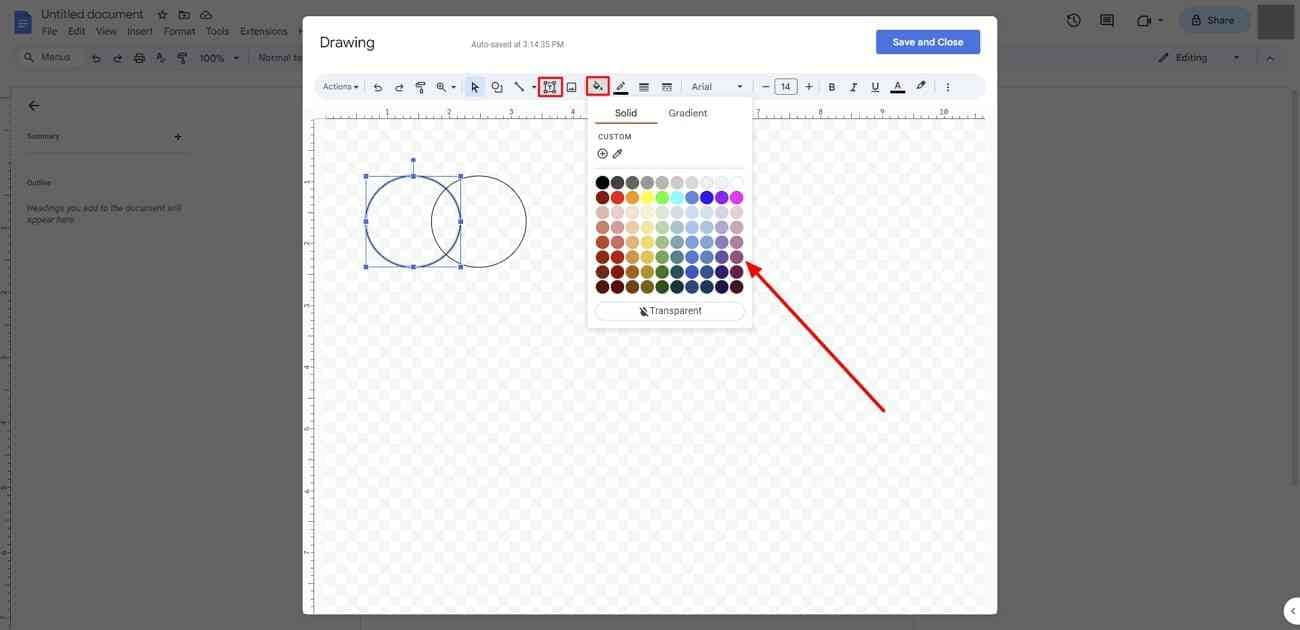
Step 4. You can select the “Fill Color” option to add colors to your Venn diagram. You can also keep your circle transparent. While staying at the drawing panel, click on "Text Box." By doing so, you can add text to your Venn diagrams in your desired font, size, and style.
Part 3. How to Generate Perfect Venn Diagram in Google Slides?
On Google Slides, you can generate Venn diagrams using the “Diagram” option. The steps are quite simple to follow. In this section, discover accurate steps to create a Venn diagram on Google Slides.
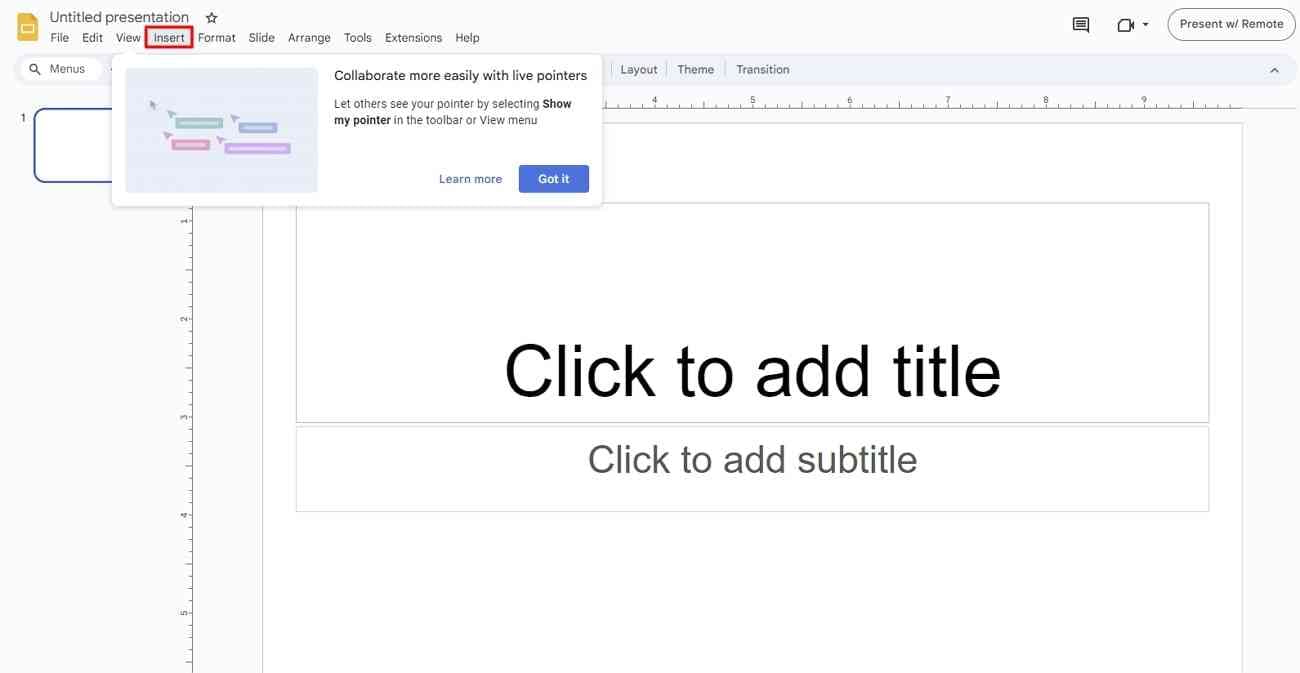
Step 1. On your Google Slides, open any presentation you desire. Now, open any slide and navigate to the “Insert” option.
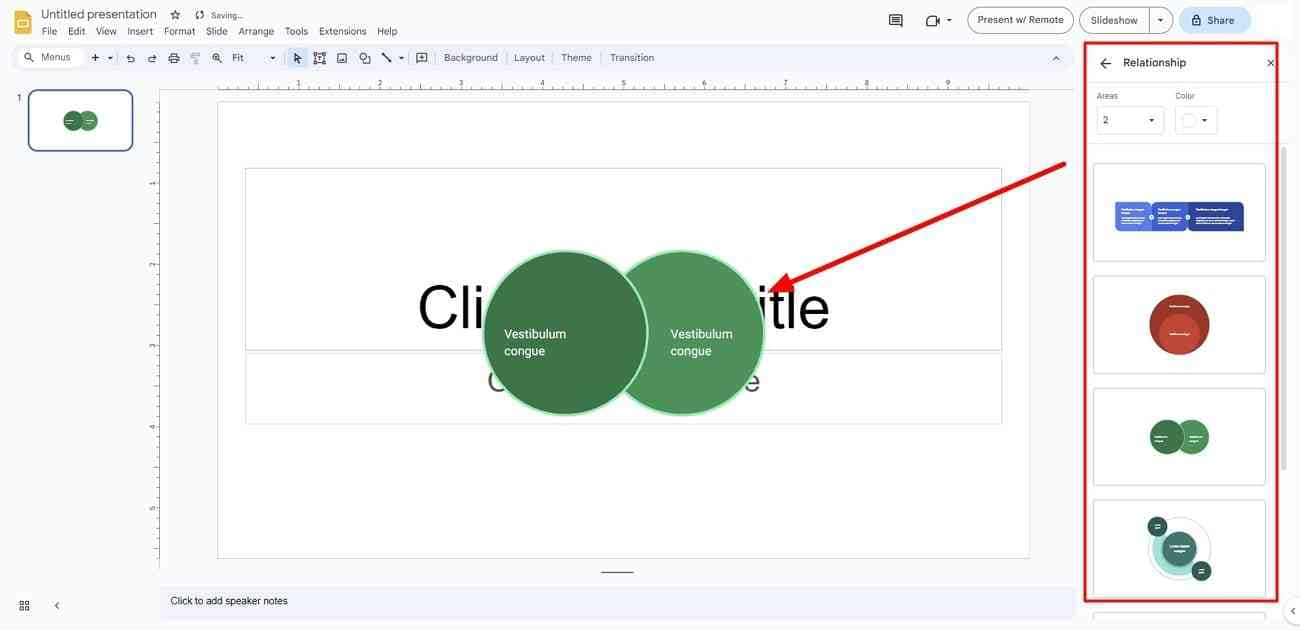
Step 2. Afterward, select “Diagram” and tap the “Relationship” option. This will instantly open a Relationship pane on your screen. From there, you can choose any desired Venn diagram layout. By clicking any of the layouts, you can insert it in your slide.
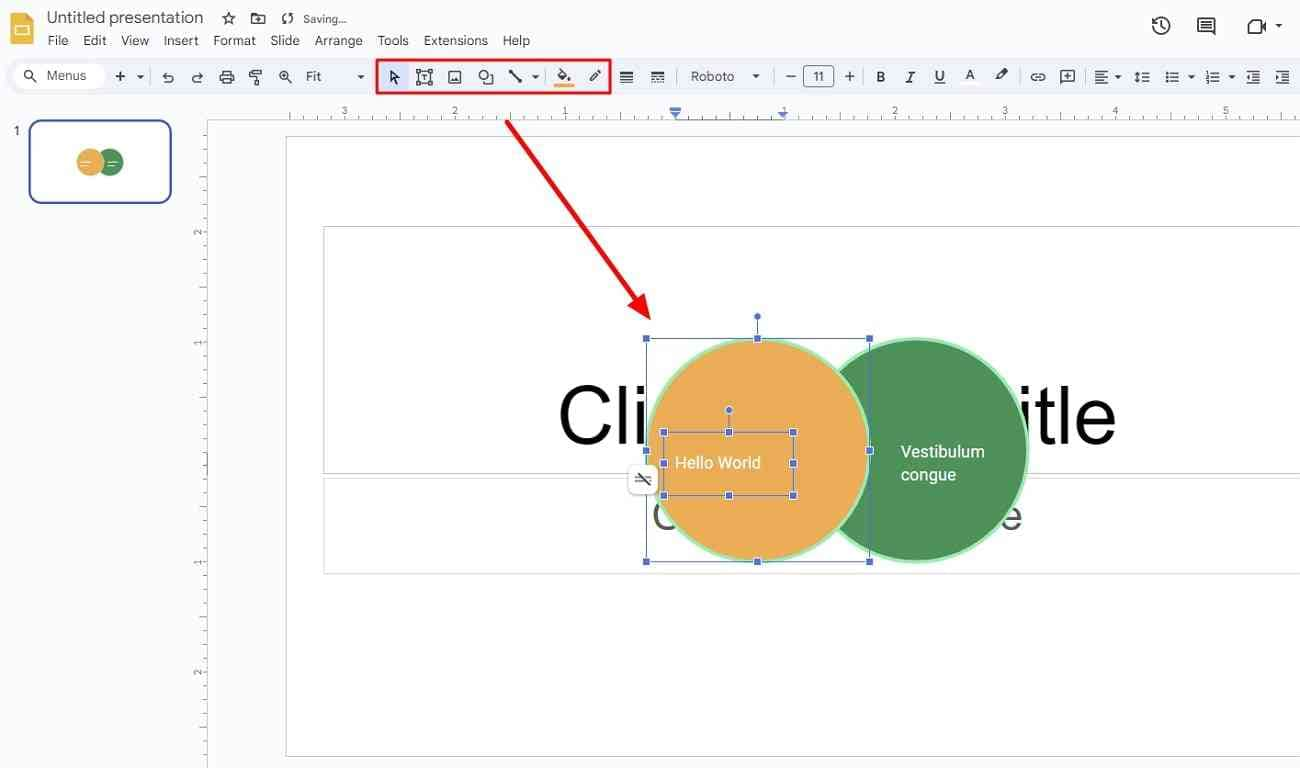
Step 3. After adding the Venn diagram, you can customize it. It provides you with options to add color and text to the Venn diagram from the provided options.
Part 4. Venn Diagram Creation Using PowerPoint
PowerPoint lets you add a Venn diagram through SmartArt diagrams. Using this option, you can instantly add a Venn diagram to your PowerPoint slides. Here are the easy steps to do so:
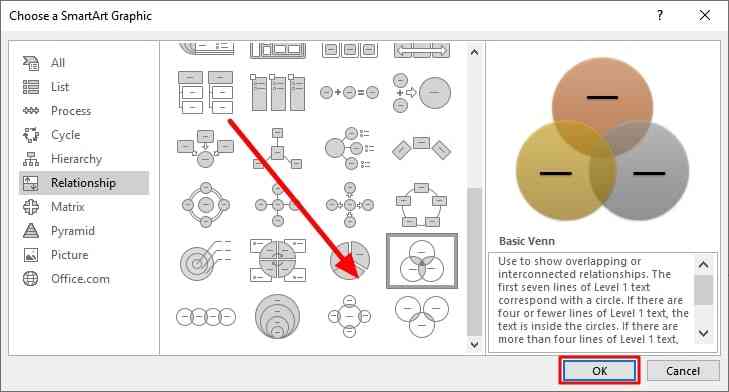
Step 1. Go to the “Insert” menu in PowerPoint slides. Select the “SmartArt” option, which will open multiple options to add graphics. From the left panel, select “Relationship.”
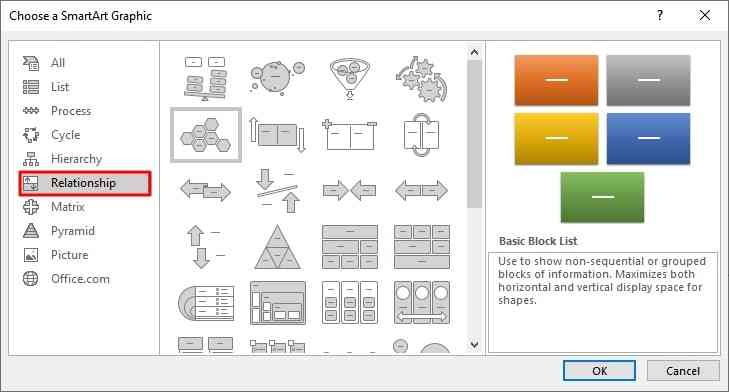
Step 2. Click on the “Venn Diagram” from the Relationship category and tap the "OK” button. You can also add Stacked Venn, Radial Venn, and Linear Venn diagrams in PowerPoint.
Part 5. Top 3 Templates Of Venn Diagram for Google Docs, Google Slides, and PowerPoint
By using PowerPoint Venn diagram templates, you can enhance your work efficiency. You can customize the Venn diagrams through the templates based on your preferences. Moreover, it can save time while editing the slides and documents. In this section, we will provide three Venn diagram templates for PPT, Google Docs, and Slides.
1. Venn Diagram Template for Google Docs
In this template of Google Docs, you can classify three different sets. Each circle in this template is created with a different color for differentiation. The colors used are blue, black, and orange. Moreover, the template lets you add textual information inside the circle.
You can also use callout text boxes attached to the circles to display additional information. In the overlapping areas, it allows you to easily add your explanations. Thus, this template provides a professional vibe to demonstrate the content flawlessly.
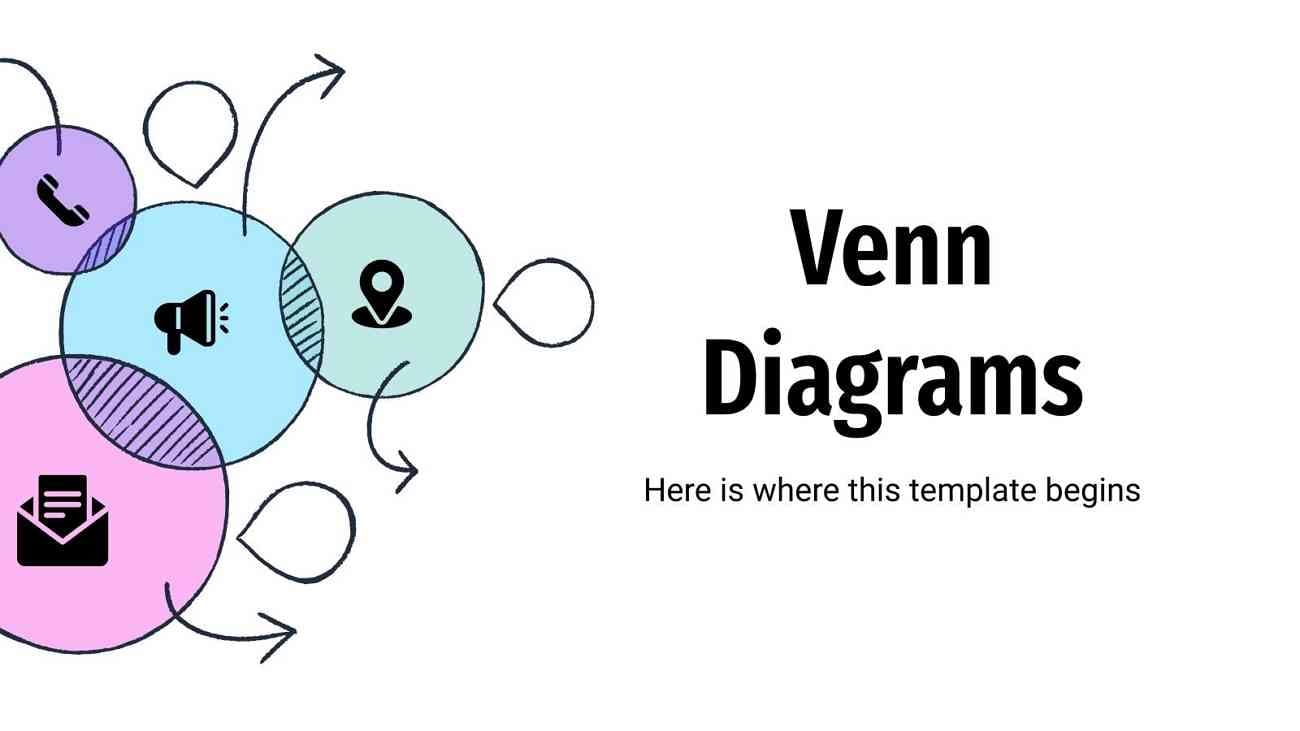
2. Venn Diagram Template for Google Slides
This particular template offers a casual yet attractive impression to the audience. It uses doodles and subtle colors to make your Venn diagrams eye-catching. Along with circles, it also offers different shapes. For example, it contains hexagons and radial charts with arrows. It’s 100% editable, so you can customize this template without restriction.
This template is created in 16:9 widescreen format, which can be ideal for all screen types. It also includes the details to edit this template and incorporate infographics.
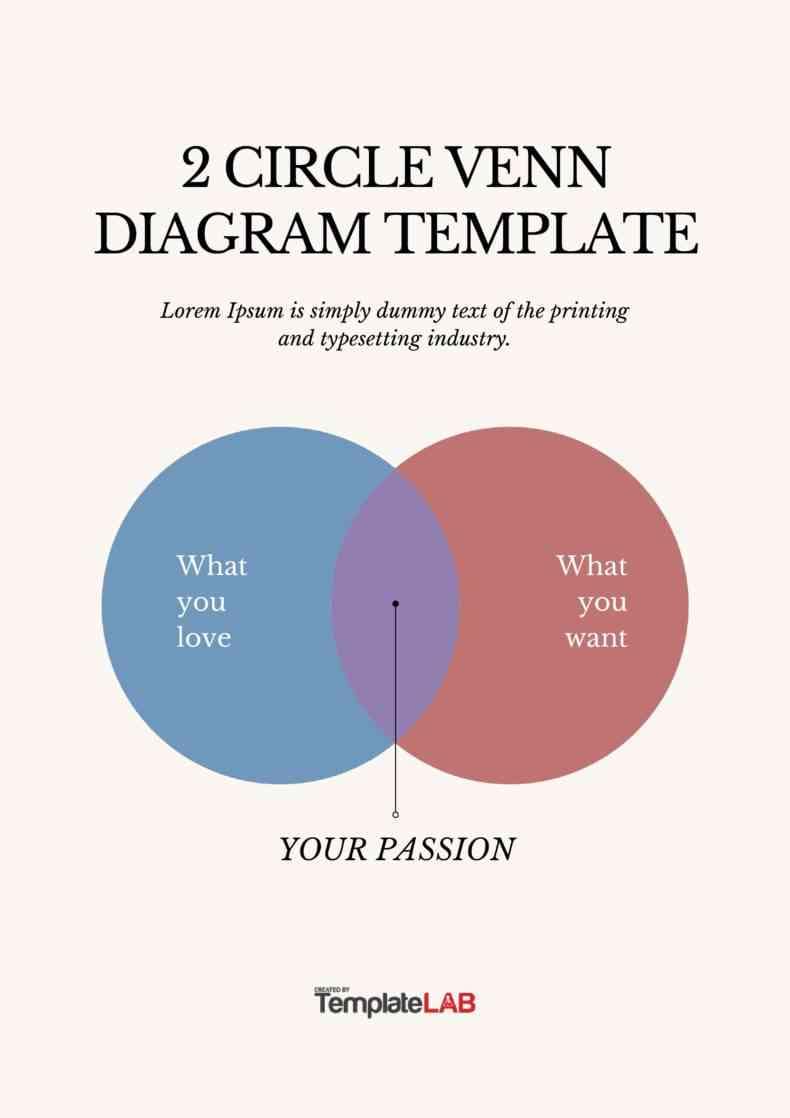
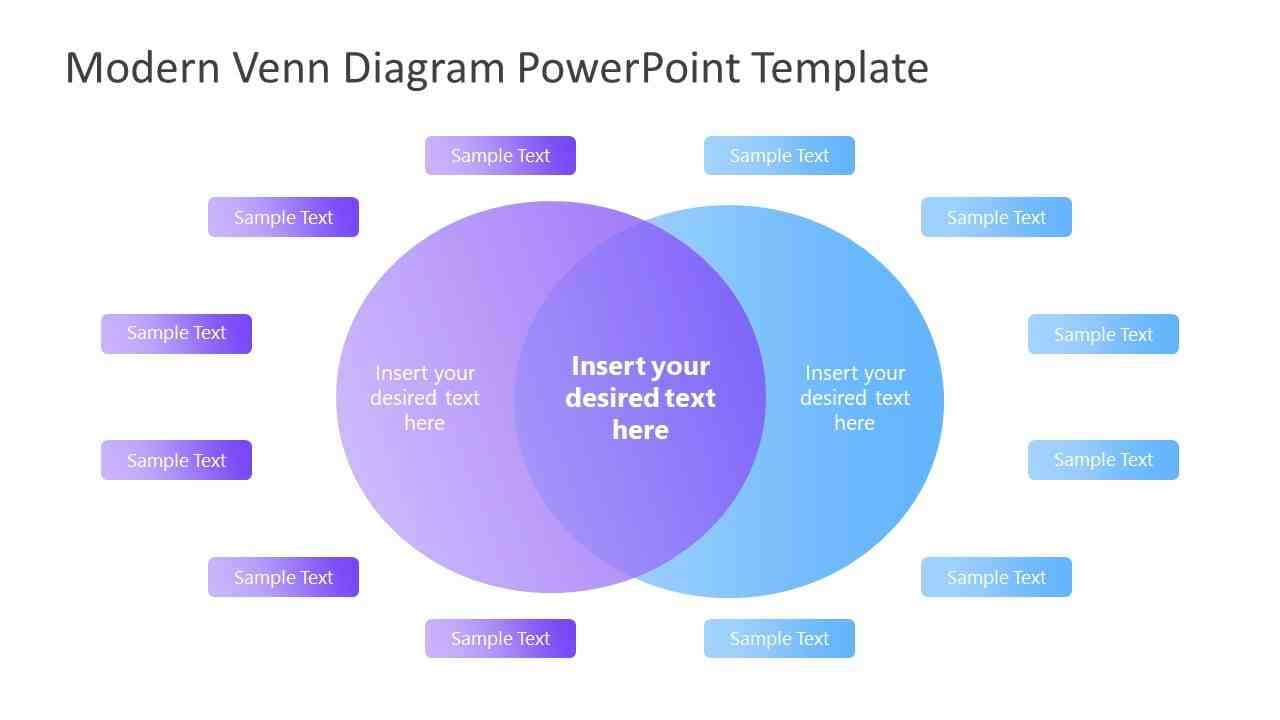
3. Venn Diagram Template for PowerPoint
This gradient Venn diagram for PowerPoint can be used for data analysis in your presentations. It uses two giant circles to display the data visually. While using this template, you can add up to 6 key items on the two circles. The design of this template is simple to help you concisely represent your information.
Moreover, this template is completely editable. You can customize it accordingly to adjust to your presentation theme. Also, modify the shades and colors of this Venn diagram from the design menu.
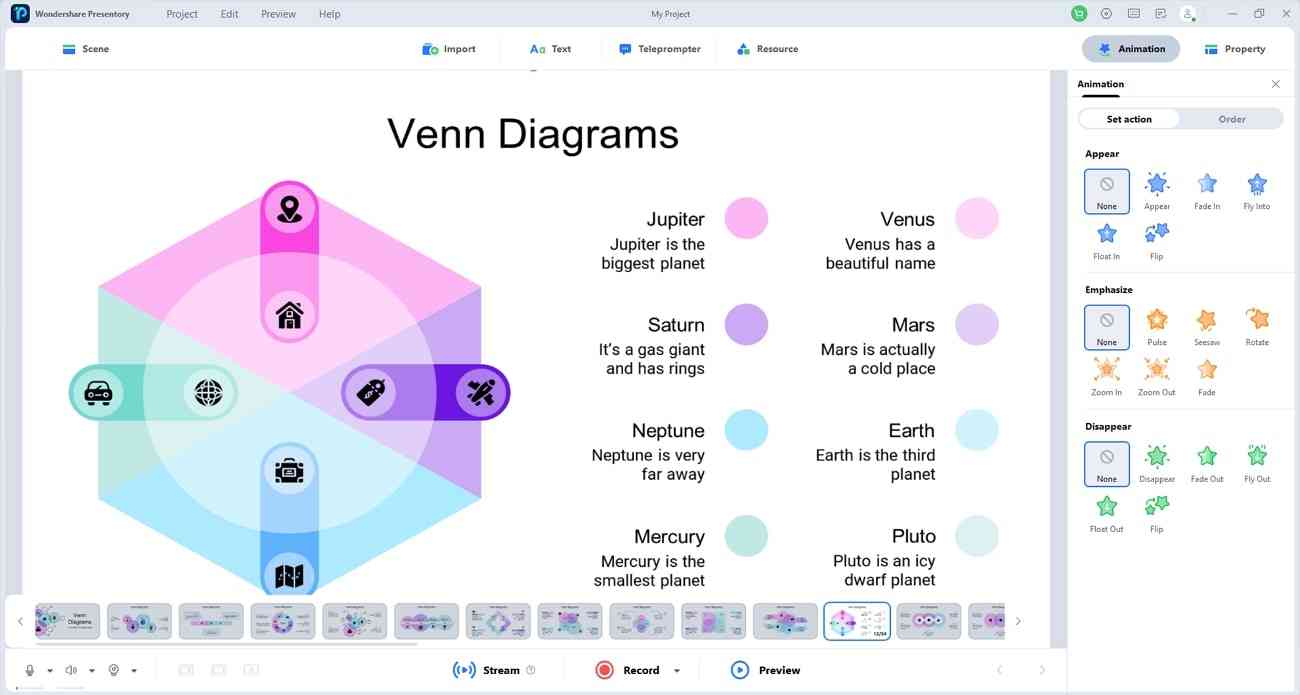
Bonus Tip. Create AI-Powered Presentations or Modify Old Presentations with Presentory
If you are frequently creating presentations, you should try Wondershare Presentory. This tool consists of an AI assistant, which can be a game-changer for you. You can launch this tool on Windows to create and edit presentations effortlessly. It’s also available for online users to modify their presentations with advanced key features. You can also import Venn diagram templates on this tool and add customization.
Moreover, it lets you change the background of your presentation slides. You can insert 3D backgrounds using this tool to create an everlasting impact. It helps you rearrange your slides and add transitional effects. This shows that Presentory is an extraordinary tool featuring many useful tools.
Key Features of Presentory
- Multiple Import Options: Using Presentory, you can import photos and videos from your PC. Moreover, you can upload PPT slides on this tool with a single click.
- AI Creator: Through the AI assistant of Presentory, craft the outline for your presentation. Just write the topic of your presentation, and the tool will generate a presentation for you.
- Animation and Transition Effects: This tool allows you to apply transitions between the slides. It also offers multiple effects to add animation. It includes the effects of fade in, fade out, appear, fly into, or float.
- Cloud Services: Presentory provides its cloud storage platform to save and access your presentation projects. You can also apply password authentication to the confidential files for additional security.